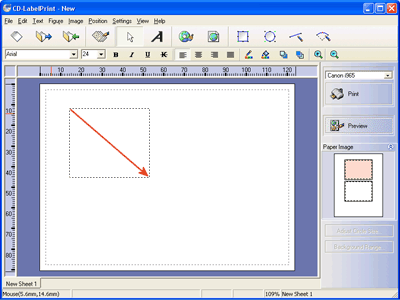
On the toolbar in the Label Edit view, click ![]() button, or on the Figure menu, select Rectangle.
button, or on the Figure menu, select Rectangle.
Place the cursor over the design field of the label. The cursor changes to a cross shape.
Drag from the starting point and drop to the end point of the figure.

A rectangle is added.
* Repeat the steps to add other figures.
You can also edit the added rectangle. Double click the figure. Rectangle Settings dialog box appears.
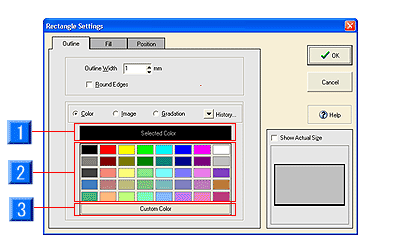
In the Outline tab, you can specify the outline color and weight. You will see the following when you check the Color on.

- Selected Color: Displays the color currently selected.
- Color Palette: Displays the monochrome provided.
- Custom Color: You can create colors not in the color
palette to use for fill color.
* For lines and curves, the tab becomes Line Color.
* To set monochrome, you can also usebutton on the toolbar in the Label Edit view.
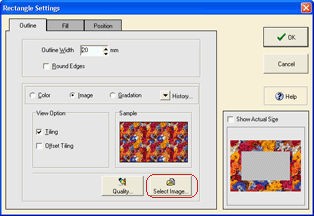
If you select Image, you will see the following. Select an image file (file, clipboard, TWAIN) using the Select Image button, and adjust the quality. Click the Quality... button. Adjust Image Quality dialog box appears.

* For information on adjusting the image quality, refer to "Functions > Editing Objects > Background/Image > Adjust an image".
* You can also set gradation. Refer to "Functions > Editing Objects > Text > Decorate text".
In the Fill tab, you can specify a fill color of the figure
as you do with the outline.
If you do not want to fill color (show outline only), check Transparent on.
* To set monochrome, you can also use ![]() button on the toolbar in the Label Edit view.
button on the toolbar in the Label Edit view.
* For lines and curves, fill color cannot be specified.
* You can set images and gradation to the fill color, as you do to the
outline.